Normalization of Sap Flow Data: A Comprehensive Guide.
The normalization of sap flow data allows researchers a relatively easy approach to presenting and analyzing sap flow data. There are many advantages for normalizing data, including measuring less correction factors and biometric parameters, but there are limitations also. In this guide, the normalization of sap flow data is comprehensively presented so that any researcher can apply the method to their data set.
Presenting and analyzing sap flow data.
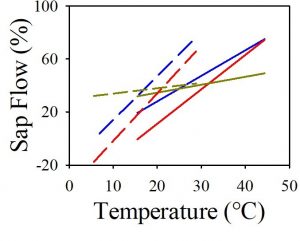
An example of normalized sap flow data. In this figure, normalized sap flow data for 6 grapevines growing at 3 sites is correlated against maximum daily air temperature. Source: Forster and Englefield (2021, Figure 6).
Sap flow data can be presented and analyzed in several different ways including:
- total volumetric sap flow as litres or kilograms per time,
- sap flux density as volumetric sap flow per unit xylem conducting area per time,
- heat velocity as distance per time,
- or as a percentage of maximum sap flow.
Data presented as total volumetric sap flow, sap flux density or heat velocity requires detailed information about the plant. Such information includes wound diameter, wood density, thermal properties, tree size, sapwood area, sensor specifications, and more. A plant specific calibration may also be required for accurate data. These additional parameters may be unknown, difficult to measure, or not accurately resolved. Therefore, there are many uncertainties on the accuracy and reliability of estimated or calculated sap flow data.
Normalization of sap flow data removes some uncertainty and in some situations provides a more reliable data analysis. Normalized sap flow data is an excellent approach when comparing experimental treatments or general trends of sap flow are required. However, there is a trade-off. Normalized sap flow data is presented as a percentage. Therefore, it cannot be used where volumetric sap flow data is required such as in modelling.
Normalization of sap flow data defined.
The normalization of data is the rearrangement or organization of data so it is similar across all fields. Data normalization is a common practice across many fields of research and statistical analysis. It allows for an easier communication and comparison of complex data sets.
Normalization of sap flow data can be achieved in various ways. For example, total volumetric sap flow is dependent on plant size where larger plants will have more sap flow because they are bigger in size. Dividing total volumetric sap flow by leaf area, canopy projection area, diameter at breast height, basal diameter, or some other biometric parameter, normalizes data between plants of different size.
However, sap flow normalization usually refers to converting sap flow or heat velocity data into a percentage of maximum flow or velocity. Sap flow data, therefore, is presented as a percentage following normalization.
How to normalize sap flow data.
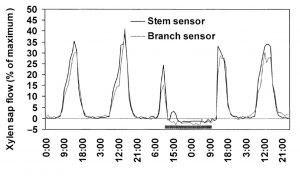
Normalized sap flow data was used to demonstrate foliar water uptake in Californian redwoods. Source: Burgess and Dawson 2004, Figure 5.
The data for normalization can be heat velocity or raw data. This is the advantage of sap flow data normalization. Information or values on tree parameters such as trunk diameter, sapwood moisture content, thermal diffusivity, wounding, etc, are not required.
Also, the time length of data can be hourly, daily, or even weekly or seasonal. The time length of interest will depend on the hypotheses being tested and the motivation for the data analysis.
Once data has been collected, use the follow steps to normalize the data.
Step 1: organize the sap flow data into a meaningful period. For example, the length of an experimental where there was a control and treatment group, or a growing season from bud burst to senescence for a deciduous tree, or a calendar year, etc.
Step 2: find the maximum value from the dataset.
Step 3: divide the remaining data by the maximum value and then multiply by 100 for the percentage. Here is the sap flow normalization equation:
Normalized sap flow = (current value / maximum value) X 100
Negative normalized sap flow data.
Negative normalized sap flow data is possible and is not an error. Negative data arises when sap flow is negative. This is known as reverse sap flow which is the movement of sap flow from the canopy towards stems, roots and soils (as opposed to “normal” sap flow which is in the direction of soils, roots, stems and canopy).
Reverse sap flow is an example of hydraulic redistribution which is an important physiological process for many plant species. Further information on hydraulic redistribution can be found here.
Careful handling of radial profiles is required.
The normalization of sap flow data is a relatively easy analytical process. Yet, consistency in data handling is important for meaningful comparisons between individuals and experimental treatments.
In particular, radial sap flow profiles will likely show different patterns of relative sap flow. If normalized data compares different positions across the radial profile, then the interpretation of the data may be incorrect.
An example will highlight this issue. The Implexx Sap Flow Sensor measures two points along the radial profile: outer and inner sapwood. The outer sapwood is a radial position towards the bark whereas the inner sapwood is towards the heartwood or inside of the tree. Sap flow tends to be higher in outer than inner sapwood. Therefore, when comparing between individuals or experimental treatments, it is important to only compare the outer positions. Or, for consistency, only compare the inner positions.
It will be incorrect to compare the outer position from plant A with the inner position from plant B. However, a comparison of normalized data between the outer and inner position of the same plant may yield interesting physiological insights. In this case, a comparison of the outer position of plant A with the inner position of plant A is appropriate.
The advantages and limitations of normalized sap flow data.
Advantages:
- Negates the need to measure correction factors including wound diameter, thermal diffusivity, sapwood moisture content, sapwood density, and more.
- Negates the need to measure biometric parameters such as trunk diameter, leaf area, sapwood area, and more.
- Potentially easier statistical analysis because data are similar across individuals and treatments.
- Irrigation estimates, such as the Irrigation Curves concept, are easier with normalized data.
Limitations:
- Loss of important plant physiological information such as sap flux density and volumetric sap flow.
- The use of data in modelling is likely not possible. Most physiological, hydrological or climate models require sap flux density or volumetric sap flow values which are lost when normalizing sap flow data as a percentage.
- A comparison with evapotranspiration models, or soil-plant-atmosphere continuum models, is not possible.
- Using sap flow data to estimate other parameters, such as canopy stomatal conductance, is not possible.
Some ideas on how to use normalized sap flow data in scientific research.
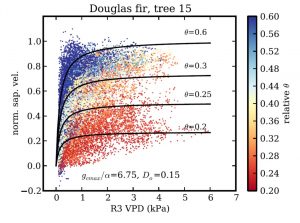
In this example, normalized sap flow data were correlated against vapour pressure deficit (VPD) for varying levels of soil water content in Douglas Fir. Source: Link et al 2014, Figure 6.
Normalized sap flow data is best employed when sap flow correction factors, or plant biometric parameters, are difficult to measure or have not been collected. Here are some other suggestions on how normalized sap flow data can be used in scientific research. This list is not exhaustive and there are many ways normalized data can be used.
- Comparing experimental treatments.
- Temporal data analysis – for example, comparing seasonal peak sap flow or daily maximum sap flow.
- Hydraulic redistribution and the directional flow of sap in roots, trunks or branches. For example, Burgess and Dawson (2004) foliar uptake of moisture in Californian redwoods (Sequioa sempervirens) via normalized sap flow data.
- A comparison of outer and inner radial positions may show root water uptake at different soil depths.
- Interannual and seasonal comparison of multiple species with differing wood and biometric parameters. For example, Link et al (2014) used normalized sap flow data to examine the differences between 26 trees across 3 different sites and over 3 years of data.
- Normalized sap flow data can be used in irrigation as demonstrated by the “sap flow index”.
- Normalizing empirical sap flow methods for correct data analysis. For example, the thermal dissipation probe (TDP), or Granier method, is an empirical sap flow method which means every sensor and installation should be calibrated (or, at least, the calibration equation should be checked or verified). Often, calibration of TDP is difficult or impractical and, therefore, volumetric sap flow or sap flux density data cannot reliably be analyzed. Normalization of TDP data is an excellent option in this situation. For example, Wu et al (2018) normalized sap flow data measured via thermal dissipation probes because of difficulties and uncertainties with calibration and correction factors.
A case study: plant responses to extreme temperature events and heatwaves.
Understanding the physiological response of plants to extreme weather events, such as heatwaves, is increasingly important. As atmospheric greenhouse gases increase, it is expected that extreme temperature and heatwaves will be more frequent and intense in the future. Natural vegetation and economic crop response to extreme events is important for ecosystem functioning, biodiversity, and food security.
Forster and Englefield (2021) examined the sap flow response to extreme temperature in four grapevine varieties in the Riverina region of New South Wales, Australia. Implexx Sap Flow Sensors were installed on the trunks of the grapevines and data were collected over an entire growing season.
As the sap flow sensors were installed on four different varieties of grapevine, it was necessary to measure additional variety specific parameters including wood density, moisture content, and sapwood area. However, in grapevines these parameters are difficult to resolve accurately. Sapwood area, in particular, is difficult to precisely measure in grapevines. Xylem anatomy in grapevines is tortuous and convoluted. Therefore, sapwood distribution is not uniform across the trunk or at various heights along the trunk. Sapwood area can only be accurately measured by destructively harvesting, or cutting, the trunk into segments. Destructive measurements at the study sites were not possible for this research.
Due to this uncertainty, the researchers decided to analyze the sap flow dataset via normalizing sap flow data. The normalization of sap flow data was quick and easy and resolved uncertainties over biometric parameter measurements. Furthermore, normalization was appropriate for this study because it addressed the hypothesis that there was a proportionate, or relative, sap flow response to extreme temperature events. The study did not require absolute values of sap flow (i.e., volumetric sap flow or sap flux density) for hypothesis testing.
The study found that sap flow was not affected by extreme temperature when soil moisture was high under well-irrigation conditions. The study also found that nocturnal sap flow was lower on nights of mild temperature versus warm, hot or extreme temperature. The following figure shows normalized nocturnal sap flow data from the study demonstrating grapevine response to temperature:
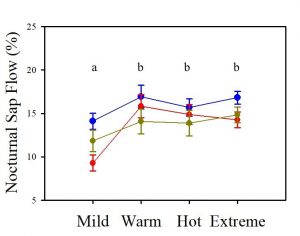
An example of normalized sap flow data from Forster and Englefield (2021, Figure 4). The figures shows nocturnal sap flow over 4 temperature nights: mild, warm, hot and extreme for 3 study sites for grapevine species.