5 Must Read Evapotranspiration and Sap Flow Papers.
The intricate interplay between sap flow, evapotranspiration, and environmental variables forms a complex web that researchers have been striving to untangle for decades. Scientific research across the globe, from the United States to Brazil through Japan, South Korea, and Europe (Spain, France, etc), has enquired into the workings of sap flow and evapotranspiration.
This article delves into five key studies that every student of the science of sap flow must read. These pivotal studies have significantly contributed to our understanding of these dynamics, spanning from the early exploration of sap flow in European oak forests to the recent evaluation of evapotranspiration models in predicting transpiration to the testing the accuracy of sap flow sensing technology.
1. An early paper incorporating sap flow and evapotranspiration dynamics in a European forest.
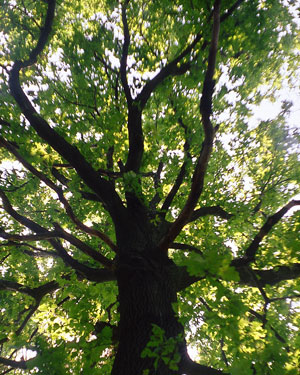
Figure 1. An oak tree (Quercus robur). Image source: Stefanst at English Wikipedia.
In 1982, Čermák et al published a paper quantifying the relative contribution of the tree canopy to total forest potential evapotranspiration. This paper highlighted the importance of sap flow sensors in differentiating the components of water use in complex vegetation such as the oak forests of Europe.
A three-year study investigated sap flow and transpiration dynamics in mature oak trees in a floodplain forest. High sap flow rates (up to 400 kg per day) occurred under optimal soil water conditions. Canopy transpiration accounted for 80% of potential evapotranspiration, with a daily water reserve depletion of 0.4 mm on average. Results are valuable for ecophysiological, hydrological studies, and forest structure evaluation.
Reference:
2. A simple model for the accurate prediction of sap flow from evapotranspiration.

Figure 2. Walnut (Juglans spp.) was one of the species measured in the study by Pereira et al (2006). Image source: Danielle Colvin, stuff.co.nz
The study by Pereira et al (2006) presents a method to estimate irrigated tree transpiration using the Penman-Monteith reference evapotranspiration model. It discusses the factors influencing evapotranspiration, such as radiation, temperature, humidity, and wind speed, and their impact on plant transpiration. The research was conducted on irrigated orchard apple trees, olives,
grapevines, kiwifruit, and walnuts in New Zealand. The study emphasizes the importance of accurately estimating transpiration for effective irrigation management. It also highlights the relationship between canopy leaf area and individual plant water use, providing valuable insights for orchard and isolated plant management. The research offers a practical approach to estimate transpiration, contributing to improved water resource management in agricultural settings.
The model proposed by Pereira et al. was later renamed the E2.88 model by Forster (2021).
References:
3. Extending the E2.88 model across 20 theoretical evapotranspiration models.
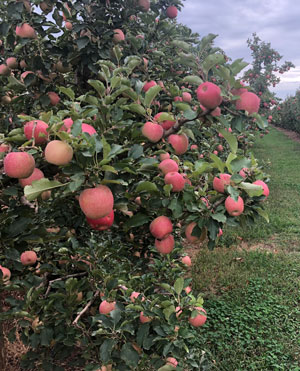
Figure 3. An apple and pear orchard from the Yarra Valley, Victoria, Australia, was the study site for Forster et al., (2021).
The study by Forster et al (2022) evaluated 20 E2.88 models for predicting transpiration in apple and pear trees, finding that the Penman-Monteith ASCE-EWRI model had the highest predictive power for apple and the Valiantzas model for pear.
Models including a humidity parameter showed stronger predictive power. However, the accuracy of the E2.88 models decreased during early and late growing seasons due to phenological influences. The study highlighted the correlation between sap flow and evapotranspiration, emphasizing the impact of phenology and environmental factors on model accuracy.
Overall, the research provided insights into the performance of E2.88 models in predicting transpiration for apple and pear trees.
Reference:
4. Evapotranspiration models can be used to test the accuracy of sap flow sensors.
Checking and testing the accuracy of sap flow sensing technology is difficult and often requires complex and expensive instrumentation. A method that simplifies the process will improve sap flow research.
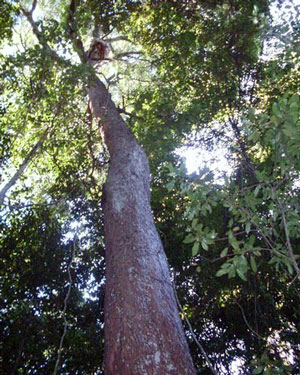
Figure 4. Lilly Pilly (Syzygium paniculatum) was one of the species from the sap flow and evapotranspiration study by Forster (2021)
To this end, Forster (2021) proposed that the E2.88 model potentially offers an avenue for the relatively quick, easy, and inexpensive testing of sap flow sensors and methods. In the research, three sap flow methods were tested against the E2.88 model: heat ratio (HRM), Tmax, and Dual Method Approach (DMA).
The study found that the DMA was the most accurate sap flow method followed by the HRM and Tmax. The DMA had an error range between 0.5 to 3.3%, an average precision of 0.972, and the smallest RMSE values for all three species. In contrast, the HRM had a bias towards underestimation in two of the species,
whereas the Tmax showed a bias towards overestimation.
The study also found that the HRM and Tmax are limited to slow and fast heat velocities, respectively, and that the DMA theoretically combines slow and fast heat pulse methods to describe the entire observable measurement range of heat velocity in xylem.
Overall, the study highlights the importance of using accurate and consistent sap flow methods to ensure the validity and reliability of the findings across studies, experiments, and models, and that the E2.88 evapotranspiration model potentially provides a robust testing mechanism.
Reference:
5. Sap flow, evapotranspiration, and extreme weather events (heatwaves).
Figure 5. Grapevines (Vitis vinifera) was the study species of Forster and Englefield (2021).
The relationship between sap flow, evapotranspiration, and heatwaves is a complex interplay that is influenced by various environmental factors. In the context of extreme temperature events, such as heatwaves, the response of sap flow in plants is crucial for understanding their water use and growth dynamics.
In the study by Forster & Englefield (2021), it was found that sap flow was positively correlated with temperature/VPD (Vapour Pressure Deficit) and negatively correlated with relative humidity (RH) over a diel time period. This indicates that higher temperatures and VPD can lead to increased sap flow, while lower relative humidity can also contribute to higher sap flow. However, the relationship between sap flow and environmental variables varied during different time periods. For instance, during the diurnal period, there was only a negative correlation between sap flow and relative humidity, and no correlation between sap flow and temperature. Conversely, during the nocturnal period, there was a strong correlation between sap flow and temperature, and a weaker, albeit significant, correlation between sap flow and relative humidity.
Evapotranspiration, which summarizes and models multiple biophysical variables including temperature, humidity, wind speed, and solar radiation, is an important parameter in understanding the plant physiological response to ex
treme heat events. It is expected that there should be a strong correlation between plant physiological response, such as water use and growth dynamics, and evapotranspiration in the context of extreme heat events. Additionally, access to ample soil moisture resources, often supplemented via irrigation, can alter the response of plants to extreme heat events. Ample soil moisture enables plants to maintain or increase transpiration during extreme heat events, thereby creating a canopy cooling effect.
Overall, the relationship between sap flow, evapotranspiration, and heatwaves is influenced by a combination of environmental variables such as temperature, humidity, wind speed, and soil moisture. Understanding these relationships is essential for assessing the impact of extreme temperature events on plant water use and growth dynamics.
Reference: