Evapotranspiration.
Evapotranspiration and sap flow explained.
Sap flow measurements and sensor technology are an important tool in understanding evapotranspiration. However, sap flow and evapotranspiration are distinct process. Sap flow is the movement of fluid (i.e., water) within plants whereas evapotranspiration is the exchange of water between vegetation, as well as land and water surfaces, with the atmosphere. Therefore, is it realistic to use sap flow measurements to understand evapotranspiration? What is the similarity between the different parameters? And does the similarity increase or decrease between seasons, life or growth cycles, and soil moisture availability?
New research published by researchers from Implexx and Griffith University, Queensland, Australia, have addressed these questions by comparing the accuracy of 20 different evapotranspiration models in estimating sap flow in apple and pear trees. The research found that sap flow can reliably be estimated from evapotranspiration models under certain conditions. But there are periods when sap flow has a weaker relationship with evapotranspiration models, and this is related to seasonal and physiological factors. The research has important ramifications because it concludes that evapotranspiration models reliably estimate plant water use, but they can be improved by considering seasonal and physiological factors.
Reference evapotranspiration models.
As direct measurement of evapotranspiration proves challenging, scientists rely on models based on biophysical principles. Theoretical models, applicable across diverse situations, and empirical models, tailored for specific locations or applications, offer distinct advantages. The research by Forster et al. (2022) focuses on theoretical models, selecting 20, including Penman-Monteith, Hargreaves and Samani, Capiro, Priestly-Taylor, and Valiantzas, to assess their accuracy in estimating sap flow.
The E2.88 model.
The E2.88 model is a reference evapotranspiration model that estimates the potential evapotranspiration of a reference crop, normalized by the leaf area of the reference crop (Pereira et al., 2006). The model is derived from the Penman-Monteith FAO56 model and is calculated as ETo/2.88, where ETo is the reference evapotranspiration. The E2.88 model has been shown to have good predictive power for transpiration in several woody tree species, including apple and pear trees (Forster, 2021).
Previously, the Penman-Monteith FAO56 model was used as the basis for the E2.88 model. This new study tested the data against an additional 19 reference evapotranspiration models to determine the generality of the E2.88 model.
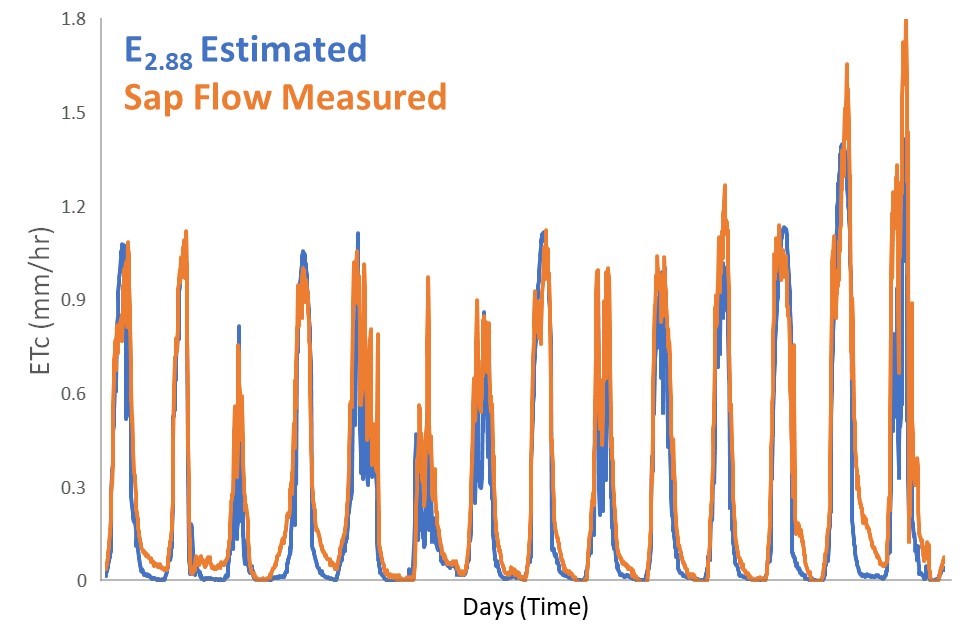
Figure 1. An example of the relationship between sap flow, normalised by total plant leaf area, and the E2.88 model (reference evapotranspiration normalised by leaf area). The data were measured on a Lilly Pilly tree from the study by Forster (2021).
The study site and measured tree species.
Conducted in a Yarra Valley orchard in Victoria, Australia, the study focuses on apple and pear trees, each approximately 15 years old, with varying canopy sizes and shapes. The research spans the austral growing season from October 2020 to June 2021, capturing diverse environmental conditions.
Sap flow and transpiration measurements.
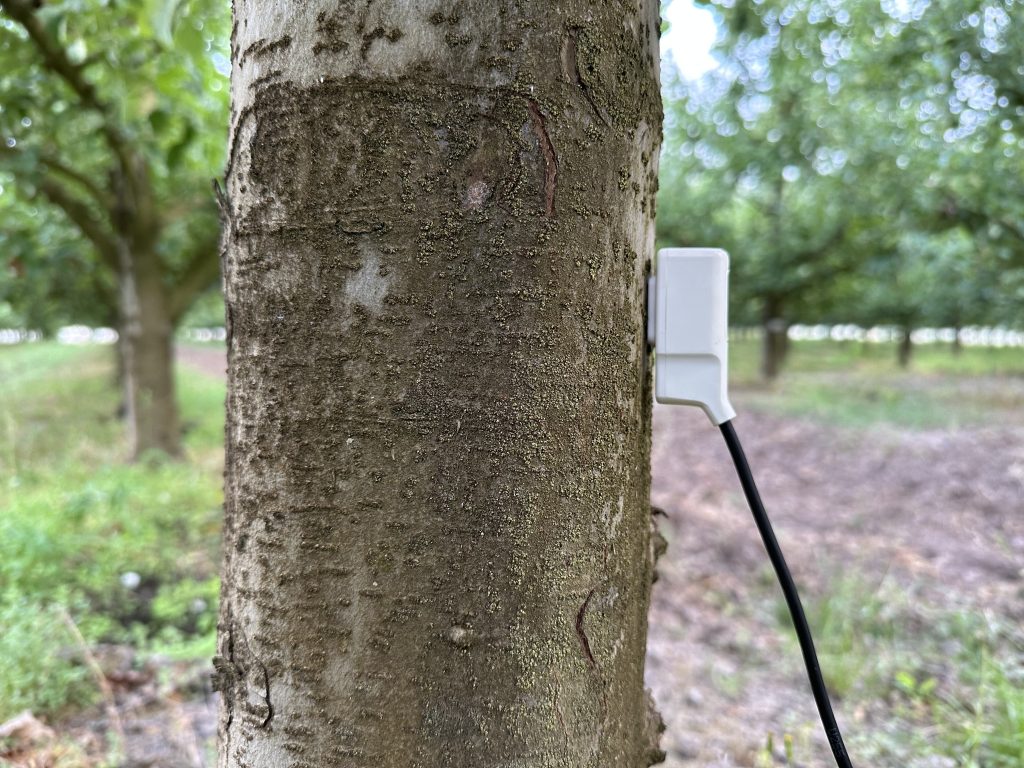
Figure 2. The Implexx Sap Flow Sensor Gen2 installed on an apple tree in the Yarra Valley, Victoria, Australia.
The study deployed Implexx Sap Flow Sensors with three stainless steel needles and NTC thermistors to measure sap flow. The Dual Method Approach (DMA) was employed, combining slow and fast flow methods, with data corrected for probe misalignment and zero flow periods.
Transpiration and canopy conductance were estimated via leaf area, leaf area index (LAI) and canopy projection area. Two independent methods were used to measure LAI: the light interception method and digital imagery. The accuracy of both methods was previously demonstrated in other studies.
Canopy projection area was assumed to be circular after averaging eight radii measurements, between the trunk and outer canopy, around the circumference of a typical tree. LAI and canopy projection area were measured at least every 2 weeks during the season and then more frequently at weekly intervals during the late season.
Evapotranspiration and weather measurements.
The study used an ATMOS 41 weather station (METER Group, Pullman, USA) with sensors for solar radiation, air temperature, relative humidity, and wind speed. The weather station was installed centrally within the orchard, 2 m above a uniform grass layer maintained at approximately 0.12 m height.
How were data and models analysed?
The study used linear regression analysis to evaluate the performance of the 20 reference evapotranspiration models against apple and pear sap flow data. The reference evapotranspiration models, and sap flow data were normalised by leaf area. Therefore, the analysis was conducted on the E2.88 models.
The models were also evaluated for their predictive power during different phenological periods. Canopy conductance and decoupling factor were calculated to understand the decoupling of canopy conductance with atmospheric evaporative demand. The study also compared the performance of different models based on their parameters and meteorological inputs.
What were the major results of the study?
- The Penman-Monteith ASCE-EWRI model had the highest predictive power for apple trees, with 7% error and r2 = 0.89, while the Valiantzas (2018, Eq. (7)) model showed 2% error and r2 = 0.96 for pear trees.
- Reference evapotranspiration models that included a humidity parameter had stronger predictive power than models excluding humidity.
- However, the predictive power of the E2.88 models decreased considering the phenological phases for each crop.
- Canopy conductance and the atmospheric decoupling factor were found to significantly influence the predictive power of the E2.88 models, with phenology decreasing their accuracy in early and late seasons.
- Overall, the study provided novel insights into the performance of E2.88 models in predicting transpiration for apple and pear trees, highlighting the influence of phenology and environmental factors on their accuracy.
What was the significance of these results?
The research emphasized the influence of phenological factors on the accuracy of E2.88 models in predicting transpiration for apple and pear trees. The study revealed that the predictive power of the models decreased during the early and late growing seasons due to a decoupling of canopy conductance with atmospheric evaporative demand.
Additionally, the incorporation of a humidity parameter in the E2.88 models was found to enhance their predictive power.
The research also pointed out the potential physiological and morphological factors contributing to the observed decoupling of canopy conductance with atmospheric evaporative demand, suggesting avenues for future research.
Furthermore, the study compared the performance of different E2.88 models and highlighted the importance of considering dynamic vegetation parameters to improve their accuracy.
So, are evapotranspiration and sap flow correlated?
The study found that sap flow, which represents tree transpiration, was highly correlated with the E2.88 model derived from the Penman-Monteith FAO56 model, as well as with several other ETo models when normalized by the hypothetical reference grass leaf area index of 2.88. This indicates a strong correlation between sap flow and evapotranspiration, supporting the use of the E2.88 model in estimating transpiration for apple and pear trees.
References.